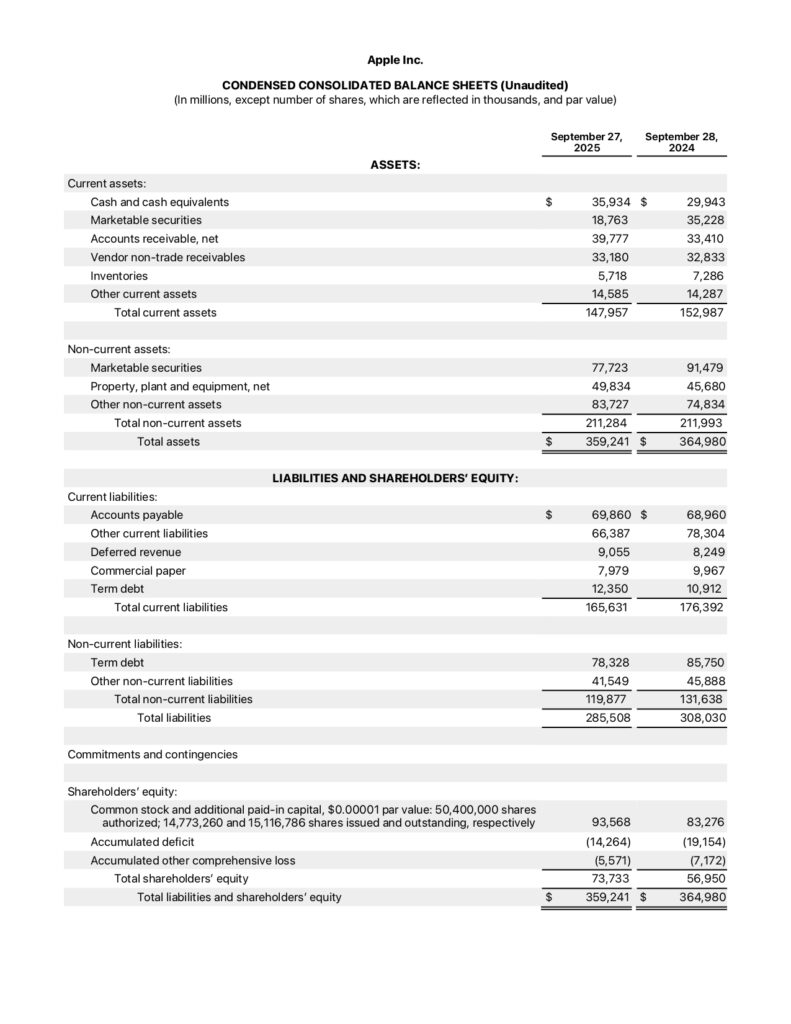
A balance sheet is a financial statement that shows what a company owns, what it owes, and what belongs to shareholders at a specific point in time. In other words, it provides a snapshot of a company’s financial position on a given date. For beginner investors, the balance sheet is a powerful tool for understanding a company’s stability, debt levels, and overall financial health.
While the income statement focuses on profits over time, the balance sheet answers a different question: How strong is this company right now? Learning to read a balance sheet helps investors evaluate risk, compare businesses, and avoid companies that may be financially fragile.
Why the Balance Sheet Matters
The balance sheet matters because profitability alone doesn’t tell the whole story. A company can report profits but still struggle if it has too much debt or not enough cash.
Investors use balance sheets to:
- Assess financial strength and stability
- Understand debt and obligations
- Evaluate liquidity (ability to pay short-term bills)
- Compare companies within the same industry
For long-term investing, strong balance sheets often indicate companies better equipped to survive economic downturns.
The Balance Sheet Equation
Every balance sheet follows the same fundamental equation:
Assets = Liabilities + Shareholders’ Equity
This equation must always balance, which is where the statement gets its name. It shows that everything a company owns is funded either by borrowing money (liabilities) or by money invested by owners (equity).
The Three Main Sections of a Balance Sheet
A balance sheet is divided into three main sections: assets, liabilities, and equity.
1. Assets: What the Company Owns
Assets are resources the company owns or controls that have economic value. Assets are usually listed in order of liquidity, meaning how easily they can be converted into cash.
Current Assets
Current assets are expected to be used or converted into cash within one year. Common examples include:
- Cash and cash equivalents
- Accounts receivable (money customers owe)
- Inventory
Beginner example:
If a company has $200,000 in cash and $150,000 in inventory, those resources can help cover near-term expenses.
Long-Term Assets
Long-term assets are used over many years and are not easily converted into cash. These include:
- Buildings and equipment
- Land
- Patents and trademarks
Strong asset bases can support growth, but investors should consider how effectively assets are used.
2. Liabilities: What the Company Owes
Liabilities represent a company’s debts and obligations. Like assets, liabilities are grouped by timing.
Current Liabilities
Current liabilities are obligations due within one year, such as:
- Accounts payable (bills owed to suppliers)
- Short-term loans
- Accrued expenses
Long-Term Liabilities
Long-term liabilities are debts due over longer periods, including:
- Long-term loans
- Bonds payable
- Lease obligations
Beginner example:
If a company has large short-term debts but limited cash, it may face liquidity problems—even if it is profitable.
3. Shareholders’ Equity: What Owners Own
Shareholders’ equity represents the portion of the company that belongs to owners after liabilities are subtracted from assets.
Equity typically includes:
- Money invested by shareholders
- Retained earnings (profits reinvested in the business)
Simple example:
If a company has $1 million in assets and $700,000 in liabilities, its equity is $300,000. That $300,000 belongs to shareholders.
Positive and growing equity often signals long-term financial strength.
A Simple Balance Sheet Example
Here’s a simplified balance sheet snapshot:
Assets
- Cash: $100,000
- Inventory: $150,000
- Equipment: $250,000
- Total assets: $500,000
Liabilities
- Accounts payable: $120,000
- Long-term debt: $180,000
- Total liabilities: $300,000
Equity
- Shareholders’ equity: $200,000
Assets ($500,000) = Liabilities ($300,000) + Equity ($200,000)
This example shows a company that owns more than it owes, a positive sign for investors.
Key Balance Sheet Ratios for Beginners
Balance sheets are often used to calculate simple ratios that highlight financial health.
Current Ratio
Current assets ÷ current liabilities
This ratio measures short-term liquidity. A ratio above 1 generally indicates the company can cover its near-term obligations.
Debt-to-Equity Ratio
Total liabilities ÷ shareholders’ equity
This ratio shows how much debt a company uses compared to equity. Lower ratios usually indicate less financial risk.
How Investors Use Balance Sheets
Investors analyze balance sheets to:
- Spot excessive debt
- Evaluate cash reserves
- Compare financial strength across companies
- Assess risk during economic downturns
For example, two companies may earn similar profits, but the one with lower debt and more cash may be better positioned for long-term success.
Balance Sheet vs. Income Statement
It’s important to understand how the balance sheet differs from the income statement:
- Income statement: Shows performance over time
- Balance sheet: Shows financial position at a point in time
Both statements work best together. Profits matter, but balance sheet strength determines whether profits are sustainable.
Common Beginner Mistakes
When reading balance sheets, beginners often:
- Focus only on assets and ignore liabilities
- Overlook short-term debt risks
- Compare companies from different industries
- Ignore trends over time
Looking at balance sheets across multiple periods helps identify improvement or deterioration.
Balance Sheets and Long-Term Investing
For long-term investors, balance sheets help identify resilient companies. Businesses with manageable debt, strong assets, and growing equity are often better prepared to handle economic uncertainty.
During market downturns, companies with weak balance sheets may struggle to survive, while financially strong companies can continue operating and even gain market share.
Tips for Beginners
To get started with balance sheets:
- Focus on cash, debt, and equity
- Compare similar companies
- Watch trends over several years
- Use balance sheets alongside other financial statements
You don’t need to analyze every line item to gain valuable insight.
Final Thoughts
The balance sheet is a financial statement that shows a company’s assets, liabilities, and equity at a specific moment in time. It reveals what a business owns, what it owes, and how much belongs to shareholders.
For beginner investors, understanding the balance sheet is a key step toward evaluating financial strength and managing risk. When used alongside income statements and cash flow statements, the balance sheet provides a clearer picture of a company’s overall health—and a stronger foundation for smart, long-term investing decisions.
Frequently Asked Questions About Balance Sheets
What is a balance sheet?
A balance sheet is a financial statement that shows a company’s financial position at a specific point in time. It lists what the company owns (assets), what it owes (liabilities), and the value remaining for shareholders (equity).
What are the main components of a balance sheet?
The three main components of a balance sheet are assets, liabilities, and shareholders’ equity. These elements follow the accounting equation: Assets = Liabilities + Equity.
Why is the balance sheet important for investors?
The balance sheet helps investors assess a company’s financial health, liquidity, and risk. It shows how much debt a company has, how easily it can meet obligations, and how efficiently it uses its resources.
What is the difference between current and non-current items?
Current items are expected to be used, sold, or paid within one year, such as cash, inventory, and short-term debt. Non-current items are long-term, including property, equipment, long-term loans, and retained earnings.
How do investors analyze a balance sheet?
Investors analyze balance sheets by reviewing liquidity ratios, debt levels, and changes over time. Comparing balance sheets across periods helps identify trends in financial strength, leverage, and capital structure.
Related Posts
Financial Statements: Official Company Financial Reports
Financial Statements: Official Company Financial Reports Financial statements are official…
EBIT Explained: Earnings Before Interest and Taxes
If you’re analyzing company earnings, reading financial statements, or evaluating…
Net Income: What It Means (Final Profit After All Expenses) and Why It Matters
Net Income: What It Means (Final Profit After All Expenses)…